Most markets are funny – most traders are clueless and lose money. Interestingly, every time one clueless person buys, another one sells, and both believe they’re astute traders until it’s too late. Instead of jumping from one guru to another, looking for the Holy Grail of trading, this guide will show you the Wyckoff trading method and help you understand its fundamental concepts.

Introduction to the Wyckoff Method
The Wyckoff method of trading is the brainchild of Richard Wyckoff, originating in the early 1930s. The approach is based on strategies and principles originally designed to aid traders and investors. However, it’s now applied to almost all categories of financial markets.
The heart of the Wyckoff method gravitates around appreciating the interchange between market cycles, the dynamics of supply and demand, and the psychology of market participants. Traders who use this method aim to interpret market movements by understanding price and volume movements, identifying distribution phases, and anticipating future trends. The Wyckoff method aims to arm traders with a structured framework to help them make informed decisions. The methodology is designed around three laws:
- The Law of Supply and Demand: At the core of Wyckoff’s method, the principle prices rise when the demand exceeds supply and fall when the supply exceeds the demand. By understanding the seesaw that causes prices to rise or fall, traders can guess the potential direction of commodity prices.
- The Law of Cause and Effect: This law enables traders and investors to set price objectives by approximating the potential extent of an emerging trend from a trading range. The law teaches that every action in the market will create a reason leading to a result. Traders can use this cause-and-effect relationship to predict where prices could be headed next.
- The law of Effort versus Result: This principle gives early warnings showing the possibility of changes that could occur shortly. This principle compares how much people are trading (effort) with its effect on prices (results). When too much activity doesn’t include a corresponding price change, market sentiment will likely be shifting.

The following are the key principles surrounding the Wyckoff Method:
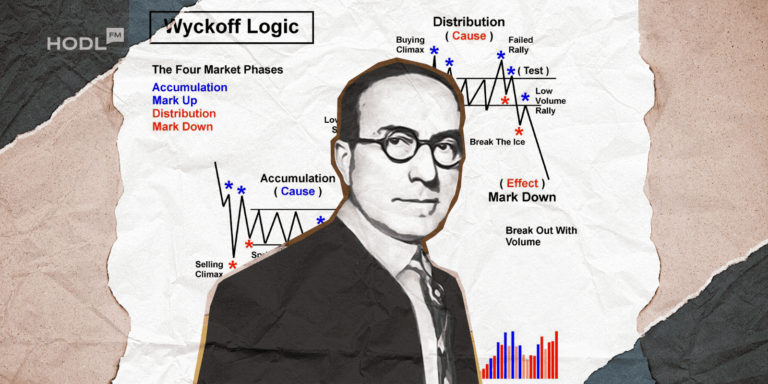
- All market structures comprise the following elements: accumulation, markup, distribution, and markdown.
- Since the law of supply and demand relative to the asset drives prices, traders should read price and volume data in unison.
- As institutional investors can impact market movements, traders are better off tracking their behavior to predict market trends.
- Even with the Wyckoff Method, accurate timing and implementing risk management practices such as identifying entry and exit points are essential.
Understanding Accumulation and Distribution
To help drive the concept home, Wyckoff developed the idea of a fictional market identity called the Composite Man, representing the biggest market players, such as institutional investors and wealthy individuals. According to Wyckoff, they always act in their best interest to buy low and sell high. Wyckoff proposed that the Composite Man’s strategy flies in the face of most retail investors, who often lose money. According to Wyckoff, the Composite Man employs a predictable strategy consisting of accumulation, uptrend, distribution, and downtrend that every investor can learn from.
Accumulation: This begins the market journey when the Composite Man accumulates assets while other investors are idle. The accumulation happens gradually to avoid effective prices significantly.
Uptrend: The composite Man has enough shares and can arbitrarily push the market prices upward. The emerging trend attracts new investors, which causes the demand to increase.
Distribution: The Composite Man begins distributing his assets and sells them profitably to investors entering the market at this late stage. The distribution phase is designed to absorb demand until it gets exhausted.
Downtrend: The market begins reverting downwards after the Composite Man has sold his shares. The supply becomes greater than the demand, and prices fall.
Wyckoff Schematics
Wyckoff schematics refer to a popular asset accumulation and distribution method for stacking many orders over a specified period. The model breaks down the accumulation and distribution phases into minute sections, covering events that could occur during a bearish or bullish trend. Wyckoff schematics are divided into five distinct phases alongside different possible scenarios covering Wyckoff events.
Wyckoff designed a five-step approach to deliver his teachings, principles, and strategies as follows:
Define the trend: Ask yourself the current trend, where it’s likely to go, and the relationship between supply and demand.
Define the asset’s strength: Interrogate the strength of the asset relative to the entire market. Check whether it’s moving in the same or opposite direction.
Define assets with a sufficient cause: Check whether there are sufficient reasons to open a position – whether the cause is strong enough to make a potential effect or rewards worth taking the risk.
Define the probability of the move you’re about to make: Ask whether the asset is ready to move or its position within the bigger market. Interrogate the meaning of the asset’s price and volume movements.
Time your entry correctly: Timing involves carefully analyzing an asset compared to the entire market.
To offer a practical scenario, a cryptocurrency trader could compare the price action of crypto A with crypto B. By cross-referencing with the Wyckoff schematic prediction about the possible movements of cryptocurrencies, the trader could establish an appropriate entry point. Compared to other technical analysis methods within the cryptocurrency sphere, such as the Dow Theory, the Wyckoff method goes further by integrating schematics.
Volume and Price Analysis
Trade volume plays a significant role within the Wyckoff method since it provides valuable information regarding what happens “behind the scenes.” Wyckoff Volume Analysis is a stepping stone for the progression during the Wyckoff Price Cycle. This is because high trade volumes can result in a sustained price move.
When the price of an asset surpasses a key level within the Wyckoff Price Cycle, the smart trader should consider making a move in case there are high trading volumes during the breakout. In the event of low trade volumes, this could indicate a false breakout rather than a real one.
Trend Identification and Trading Signals
Below are key steps you can follow when you are using the Wyckoff method to identify trends and trading signals:
Identify the Market Phase: Analyze price and volume to data to define which phase the market is in, whether accumulation, markup, distribution, or markdown.
Analyze Price and Volume: After identifying your phase, analyze the price and volume patterns to locate potential trading opportunities.
Confirm with Indicators: Use additional technical indicators to confirm your selected trading decisions.
Set Entry and Exit Points: Set your entry and exit points based on the results of your analysis – set limit orders at a resistance level in addition to a stop-loss order above the recent swing high.
Manage Risk: Risk management is crucial in cryptocurrency trading. Consider your risk tolerance level and set an appropriate stop-loss order to reduce potential losses.
Case Studies and Examples
Below are real-life examples of the Wyckoff method in action within the cryptocurrency sphere:
Bitcoin’s Accumulation Phase of 2015-2016
2015 Bitcoin (BTC) entered an accumulation phase after a significant price decline from a previous all-time high. BTC’s price mostly oscillated between $200 and $300 over a few months, with the selling climax coming in January 2015, followed by a rapid drop and a consequent recovery. The secondary test came in August 2015, when prices fell much lower. Finally, after a series of surges and falls, Bitcoin’s upward journey began in late 2016 and marked the end of its accumulation phase, heralding the start of the markup phase.
Related: The Love-Hate Relationship Between Miners and Halvings
Ethereum’s Distribution Phase of 2017-2018
Ethereum (ETH) experienced a serious bull run beginning in 2017 that reached its climax in January 2018 at around $1400. The peak came alongside extreme trading volume, which marked the buying climax. At the end of Bull-Run, the asset’s price receded significantly before rebounding further in May 2018 in what could be considered a secondary test. Nonetheless, unlike in the accumulation phase, weakening demand ensured the test didn’t exceed the buying climax price. Ethereum’s price continued to slide downwards, showing signs of weakness over the following months, initiating a markdown phase.

More Info:
Conclusion
After being around for close to a century, the Wyckoff Method is still an effective trading tool thanks to its effective theories, principles, and trading techniques. The trading model enables traders and investors to use logic instead of acting on emotions. The extensive use of the Wyckoff Method provides traders the relevant tools, allowing them to mitigate risks and increase their chances of success, especially when investing in the highly volatile cryptocurrency market.
Disclaimer: All materials on this site are for informational purposes only. None of the material should be interpreted as investment advice. Please note that despite the nature of much of the material created and hosted on this website, HODL.FM is not a financial reference resource and the opinions of authors and other contributors are their own and should not be taken as financial advice. If you require advice of this sort, HODL.FM strongly recommends contacting a qualified industry professional.